> For the complete documentation index, see [llms.txt](https://help.qonic.com/llms.txt). Markdown versions of documentation pages are available by appending `.md` to page URLs; this page is available as [Markdown](https://help.qonic.com/documentation/qonic-application/data-and-collaboration/report-panel.md).
# Report Panel
Use the Report panel to generate a table view of objects in your model along with their quantities and properties.
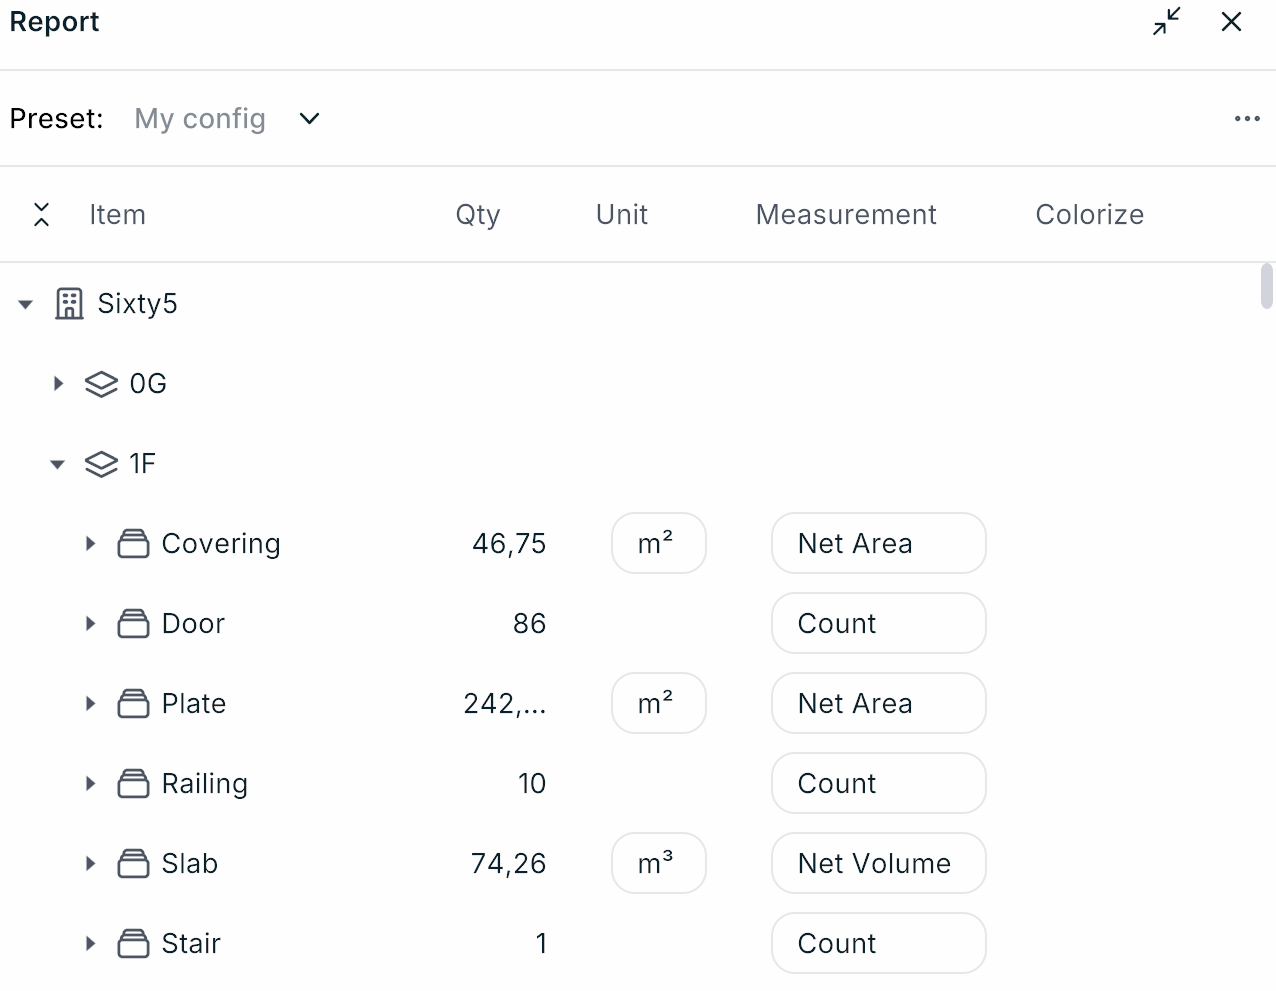
Open the Report panel by clicking the table icon on the left of your screen or by using the Shift R shortcut.
The Report panel opens as a floating window over the 3D view. Drag it by its title bar to move it and drag its edges to resize it; drop it near its original position to dock it there again. Click *Minimize* in the title bar to collapse it to its title bar and *Maximize* to restore it, or close it with the ×.
{% hint style="info" %}
The Report panel is not available on small screens, such as phones, or while you are editing a component.
{% endhint %}
When opening this panel for the first time, the grouping and filtering rules that were last used in the [Browse panel](https://help.qonic.com/documentation/qonic-application/data-and-collaboration/browse-panel.md) will be used here. You can change the configuration or edit the current one by opening the *Preset* dropdown at the top left of the panel and clicking the pencil icon next to a preset. You can find more information about groups and filters in [this article](https://help.qonic.com/documentation/qonic-application/data-and-collaboration/browse-panel.md) about the Browse panel. Browse panel configurations can be reused in the Report panel.
When you edit a saved preset, click *Save* to keep your changes or *Delete* to remove the preset. When you edit a configuration that is not saved yet, click *Apply* to use it or *Save As* to save it as a new preset. Project owners can switch on *Available to all project members* to share a preset with the whole project.
The following columns will be available in the table:
* **Item**\
This displays the objects in your model, structured using customizable grouping and filtering rules. To change this structure, open the *Preset* dropdown at the top left of the panel. Use the arrow button in the column header to expand or collapse all groups. Click an item to select the associated objects in your model; double-click to select them and zoom to them. Use Ctrl or Shift to select several rows.
* **Qty**, along with its **Unit** and **Measurement**\
For each item (row) in the report panel you can calculate a combined measurement of all objects in that row. If the row is grouped by a classification code that has measurements defined in the code library, the first of those measurements is used. The default measurement definition that is used is *Count* (*"how many objects are there of this type/with this property/of this class..."*), with the following exceptions:
* If all objects within that item are either Curtain Walls, Roofs or Walls, the default measurement will be set to *Net Area*.
* If all objects within that item are either Beams, Footings, Slabs or Columns, the default measurement will be set to *Net Volume*.
* If all objects within that item are either Duct Segments, Flow Segments, Distribution Flow Elements or Cable Carrier Segments, the default measurement will be set to *Length*.
You can choose between *Count*, *Length*, *Net Area*, *Gross Area*, *Net Volume* and *Gross Volume*, plus any measurements defined on the classification code.
Lengths, areas and volumes are shown in the [project units](https://help.qonic.com/documentation/qonic-dashboard/projects.md#project-units) by default. You can always change the Measurement and Unit of a table item by clicking the Unit or Measurement dropdown in that row; if several rows are selected, the change applies to all of them. Units of the project's unit system are listed first. To get visual feedback how a certain quantity is calculated, click the underlined quantity, or click the ellipsis icon at the end of the row (or right-click the row) and choose *Quantities preview*. Choose *Remove previews* to clear it. If one or more quantities were not able to be calculated, a warning triangle will be displayed, and the quantities preview will indicate which objects are causing the issue. A spinning circle means that the quantity is currently being calculated - this may take a while for large selections. While a row is calculating, you can stop it with *Cancel calculation* in the row menu. If a calculation was cancelled, a reload icon appears: click it, or choose *Recalculate* in the row menu, to calculate it again.
{% hint style="info" %}
**Hint:** is the user interface slow while the report panel is open? This may be due to the background calculation of quantities in your model. You can either wait for the calculations to finish (once calculated these measurements will be stored so next time this will go much faster), **or** you can hit the **Escape** key to cancel all calculations. You can restart calculations again by clicking the ellipsis icon in the top right of the panel and clicking *Recalculate all*. The same menu has *Cancel all calculations* while calculations are running.
{% endhint %}
* **Properties** (optional)\
You can add columns to your report by editing the current configuration, clicking the + icon next to *Columns* and choosing *Add property* or *Add location*. Any property currently used in the model, or a location (e.g. storey), can be added to or removed from the table. You can drag column headers to change their order. If a table item contains multiple objects with different values for a given property, these property values will be listed separated by a comma. For numeric properties, use the Σ button in the column header to switch between *Sum* (the total per row) and *Values* (the list of values).
* **Colorize**\
Click the color swatch in a row (or choose *Colorize* in the row's ellipsis menu) to give the objects in that row a temporary color override. To give every row its own color, open the ellipsis menu at the top right of the panel and choose *Colorize all*. Use *Remove colors* or *Remove all colors* to undo it.\
The colorize button will temporarily override the color of the geometry in the selected item(s), allowing you to get quick visual feedback of the geometry contained in a single table item.
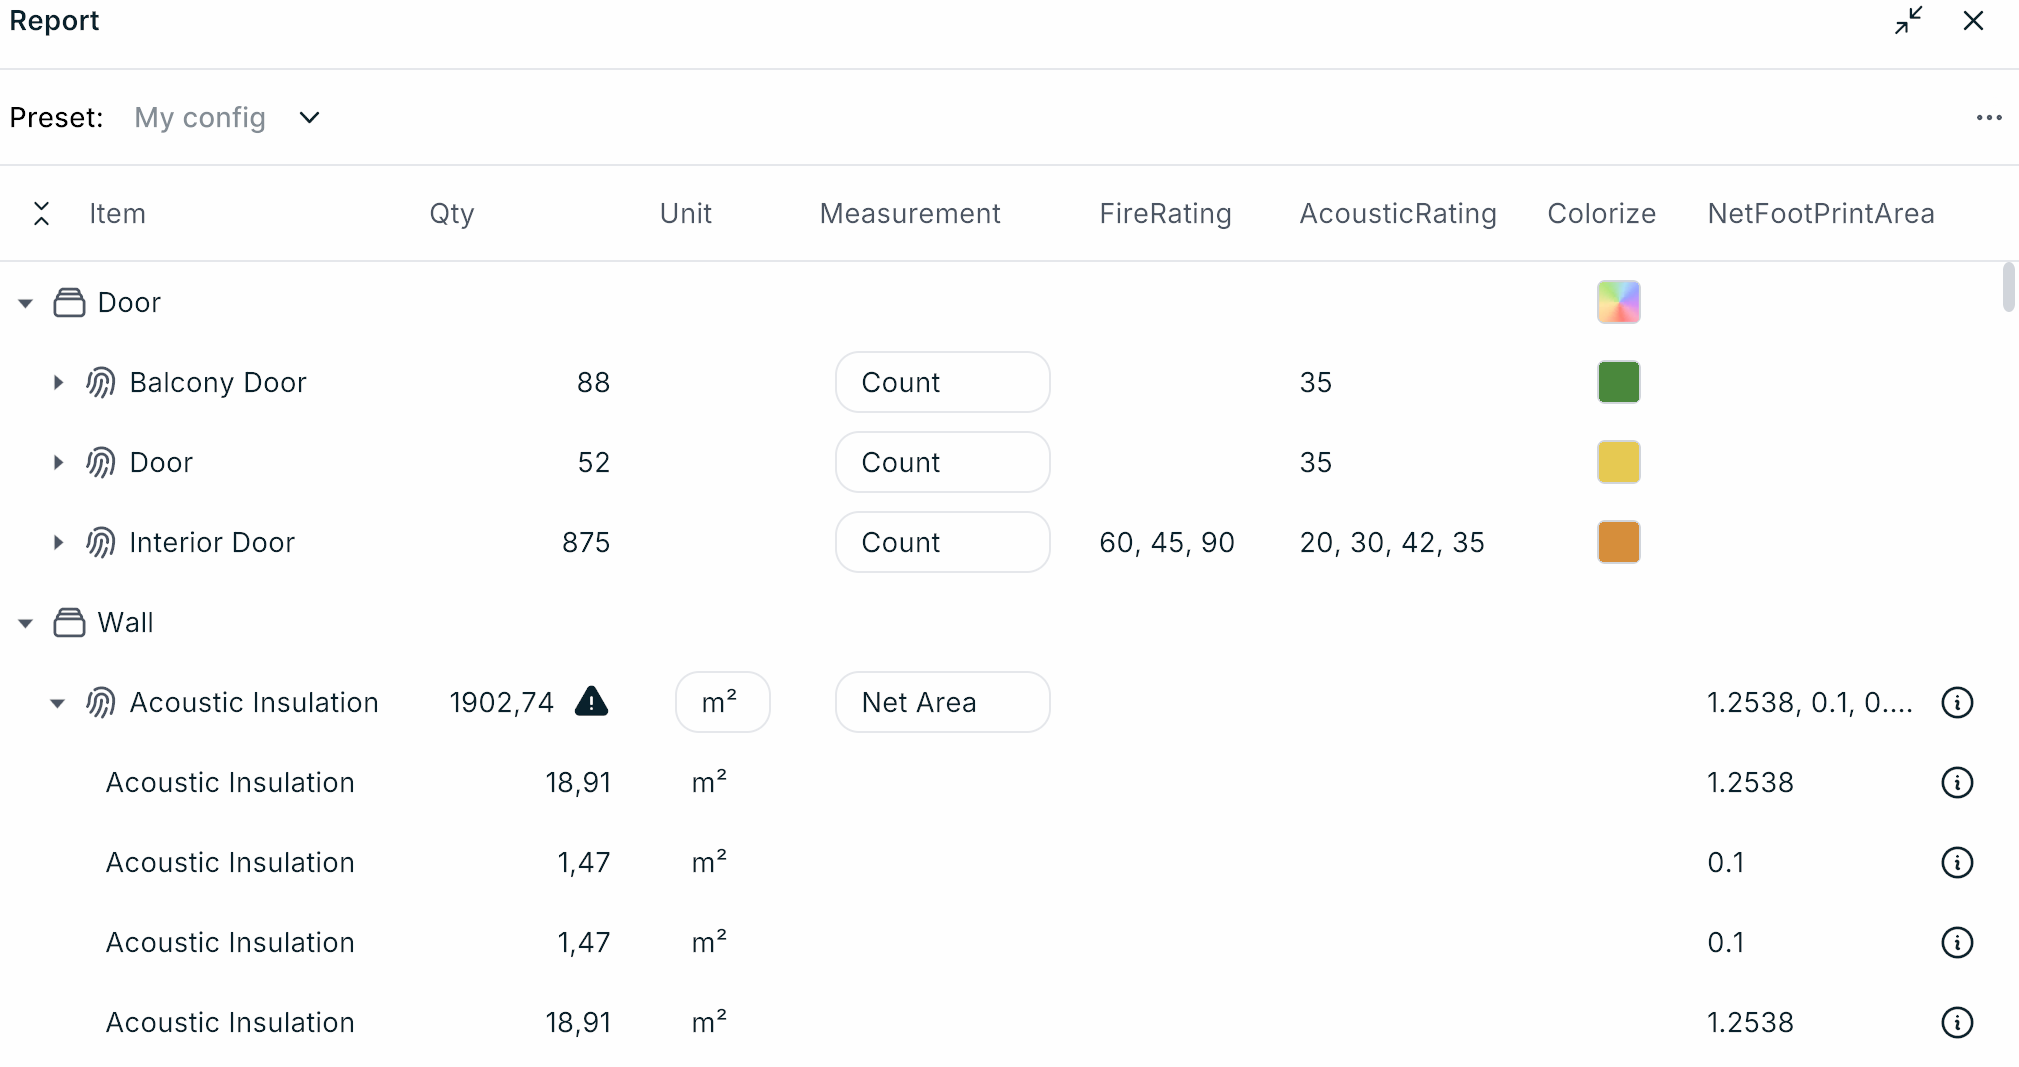
To summarize with an example, the image below has the following meaning:
* The table is first grouped by *IFC Class* (Door, Wall, ...), and then by *Name* (Balcony Door, Acoustic Insulation, ...)
* There are **88** doors with the name *Balcony Door* in the model. At least one of them has an acoustic rating of **35**. To know precisely which of the doors have this value, expand the group to show the individual doors. The Balcony Doors have a temporary green color override.
* There are **52** doors with the name *Door* in the model. At least one of them has an acoustic rating of **35**. They all have a temporary yellow color override.
* There are **875** doors with the name *Interior Door* in the model. There are interior doors with Fire Rating values **45**, **60** and **90** in this group, and with Acoustic Rating values **20**, **30**, **42** and **35**. To know precisely which of the doors have which values, expand the group to show the individual doors. They all have a temporary orange color override.
* The total combined Net Area of all walls with the name *Acoustic Insulation* is at least **1902.74 sqm**. The exact value could not be calculated because the calculation of at least one of the walls in this group has failed because of an unknown reason. Click the value with the warning triangle to see which wall is causing the issue.
* The IFC Base Quantity *Net Footprint Area* is calculated for the walls in this report. Clicking the info icon next to a calculated value will give some visual feedback in the model how this value was calculated.
Once the report is set up the way you want, you can save it to the project dashboard by clicking the ellipsis button at the top-right of the panel, choosing *Export report*, entering a name and clicking *Export*. The report is generated from the published version you have open, so publish your changes first; *Export* is disabled while you have unpublished changes. This report can now be consulted in the project [Reports](https://help.qonic.com/documentation/qonic-dashboard/reports.md) section. To export a report, you need to be a project Editor or Owner with Model Editor or Owner access to the open models.
## Version Compare
If you are comparing two versions of a model using the [Version Compare](https://help.qonic.com/documentation/qonic-dashboard/models/model-version-management.md#version-comparison) feature, the report panel is extended with specific functionality to group and filter on the changes between these versions.
When you compare versions, the *Preset* dropdown offers a *Compare config* preset that groups the report by *Modification* and adds a *Modification* column. To build your own, edit a preset, switch on *Show only items with modifications* if that is what you are interested in, and add a *Modification* group.
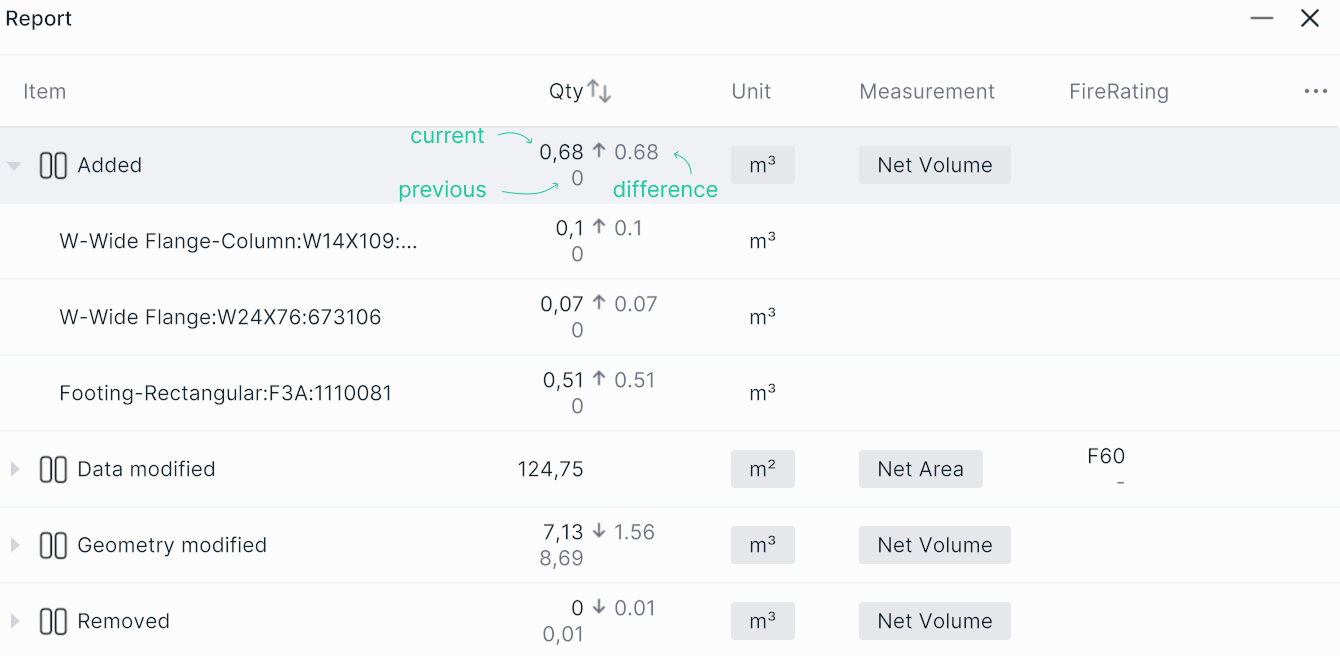
This should result in a list of all changes grouped by type of modification. If a modification has impact on that product's quantity, both the old and the new quantity of that product will be displayed, as well as the difference between the two. In the image below, the rectangular footing in the *old* version of the model had a volume of 0 m3 (it did not exist in the previous version), and in the new version it has a volume of 0.51 m3. Hence, the difference is an increase of 0.51 m3as indicated by the arrow pointing up. Double-click an entry in the report to select the associated product(s). Removed products are shown in red and the previous geometry of changed products in blue; otherwise the view zooms to the selection.
Instead of grouping by modification type you can also use this modification parameter as a filter rule (for example *Modification* is *Added*) or add it as a separate column, as shown in the image below.